In This Topic
The Graphical Editor
General
There are several toolbars that allow an easy access to the commands and to the data of the cycles.
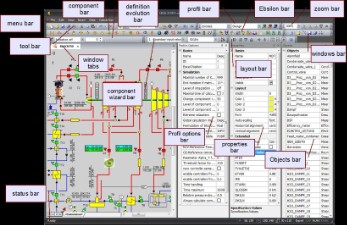
Image Title
Since the user can rearrange or disable the individual bars, the appearance on the screen may look different from the one given above. Use the "View" menu from the Menu Bar to open them again.
The Menu bar
The
menu bar consists of menus that give you access to all
EBSILON®Professional-commands via the menu hierarchy.
The Tool bar
The following main commands are present in the
tool bar:
The Ebsilon bar
The Ebsilon bar provides commands for the calculations and the default Excel-interface:
- Calling a simulation calculation,
- Calling a validation calculation,
- Importing the reference values from a design calculation for off-design calculations,
- Switching between the calculation modes "Design" and "Off-Design" (if the bulb is "bright", the design mode is active),
- Calling the EbsScript-Editor,
- Calling the Material Table Input for a component or a pipeline to be selected,
- Opening the Excel-sheet assigned to the current document for the Default Excel Interface. This starts MS Excel. This workbook remains open till you close it from within Excel.
- Reading the active profile from the corresponding Excel workbook: the specification values and the characteristics in the document are updated with the data from the workbook.
- Writing the active profile to the corresponding Excel workbook: the fields in the workbook are updated with the data from the document
The Zoom bar
The
Zoom bar has the following commands:
- Enlarging or reducing the size by specifying the zoom factor. This can be selected from the drop-down box or else can be entered in the field.
- Zoom in (by about 10%)
- Zoom out (by about 10%)
- 100%GraphicalEditor.html% is now so big that all the objects fit on the screen. This is not the same as setting the zoom factor to 100% (where the scaling is not changed).
- >>: Grow model, in order to gain more place.
The Properties bar
The properties bar displays the properties of a selected object or the common properties of several ones. They can also be modified in this bar (as an alternative to the properties window).
The advantage over the properties window is that
- the display can be maintained while work is being carried out in the circuit
- values can be changed simultaneously for several selected objects.
The properties bar is divided into the following sections:
- Basics
e.g. Description 2-4: Object description
Visible: Object visible / invisible (menu item "Show All" also shows the "invisible objects"
Layout
e.g. Width: Changing the line width - object margin
Colour 1: Changing the colour display of the object
Colour 4: Changing the colour display – object margin
Streams Change color display - define and activate 2. color for color change
Font: Changing the text formatting
- Extended Calculation settings and display settings
- Main Specification Values Changing specification values (the specification values for several selected objects can be changed simultaneously).
- Fluid Values
- Result Values
If several objects have been selected, the attributes common to all objects will be listed in the properties bar. If components with the same component number are selected as objects and all objects have the same numerical value for this property, this value will be displayed. If the numerical values are different, "<different values>" will be entered in the corresponding field.
When a value is entered, it will be allocated to all these selected objects. This option is particularly helpful for entering a specification value for several components simultaneously. If flag values with different values exist in these selected objects of the same type, these values will be shaded in yellow. If several objects with different component type are selected, only the values in the sub-groups
that are similar for all the selected objects will be displayed.
By right-clicking on the main caption “Properties“ the properties bar can be e. g.
- undocked/docked
- automatically located in the background, etc.
The Layout bar
The
Layout bar helps you to align the objects in the cycle. With the exception of the last icon ("Align with grid on/off") the icons in this bar become enabled only when several objects are selected in the cycle. Thereby, the last object selected serves as the reference object. It can be seen from the fact that the editing points of this object are filled, while the editing points of all other selected objects are shown as small, unfilled squares. The functions of the icons are as follows:
- Align left all the selected objects i.e. the selected objects are shifted to the left or to the right, till the left margins of all the selected objects match the left margin of the reference object.
- Align right all the selected objects i.e. the selected objects are shifted to the left or to the right, till the right margins of all the selected objects match the right margin of the reference object.
- Align top all the selected objects i.e. the selected objects are shifted up or down, till the top margins of all the selected objects match the top margin of the reference object.
- Align bottom all the selected objects i.e. the selected objects are shifted up or down, till the bottom margins of all the selected objects match the bottom margin of the reference object.
- Arrange all selected objects with equal horizontal spacing i.e. the selected objects are moved up or down till the horizontal spacing between all the objects is the same. The position of the uppermost and the lowermost objects is not changed thereby.
- Arrange all selected objects with equal vertical spacing i.e. the selected objects are moved left or right till the vertical spacing between all the objects is the same. The position of the leftmost and the rightmost objects is not changed thereby.
- Adjusting the width of all the selected objects: all objects are broadened or narrowed in such a way that they have the same width as the reference object (however, the minimum width for the respective component is not fallen short of).
- Adjusting the height of all the selected objects: all objects are stretched or pressed together in such a way that they have the same height as the reference object (however, the minimum height for the respective component is not fallen short of).
- Adjusting the width and the height of all the selected objects: all objects are enlarged or reduced in such a way that they have the same size as the reference object (however, the minimum size for the respective component is not fallen short of).
- Align with grid on/off: this icon works as a button. It decides the way, in which the objects can be moved in the cycle: In the enabled mode, the objects can be moved only in complete distances of the grid . In the disabled mode, the objects can be moved by arbitrary distances. However, the components and the pipelines are always aligned to the grid. This button is not effective while inserting an object or while changing the size of an object.
The Window bar
The Window bar helps you to manage the open windows and offers the following functions:
- Switch to the full screen mode: EBSILON®Professional uses the complete screen to display the current model. You can leave this mode by clicking on the icon again or by pressing the Esc-key.
- Close the active model
- Close all opened models
- Save the active model
- Save all models open
- Print the active model
- New window: another window is opened for the active model (not a new model!), both the windows display the same model
- Arrange the windows from the top left corner to the bottom right corner (cascading)
- Tile windows horizontally: the windows are arranged lying one above the other (without overlapping)
- Tile windows vertically: the windows are arranged side by side (without overlapping)
- Next window: the next window becomes the active window
- Last window: the last window becomes the active window
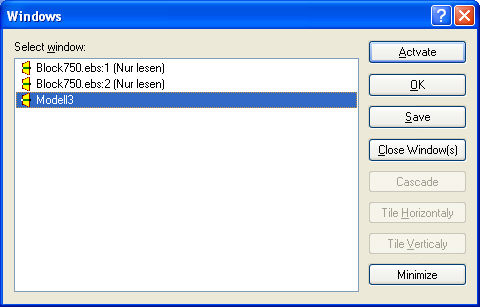
- Manage Windows:
Window-Tabs
The
Windows-Tabs help in a quick switching between the open windows. The font colour thereby indicates the corresponding switching:
- red: Window belongs to a switching, in which changes are made that have not yet been saved
- blue: active window (without the changes not saved)
- black: other window
By right-clicking, the following commands are available :
- Save the model
- Close the model
- Close all models
- Close all other models
- Copy the entire path to the clipboard
- Open the directory where the model is located in the Windows Explorer
- Splitting the window and creating another tab bar (horizontally or vertically)
The Component Wizard bar
The
Component Wizard bar is used to insert the components by number and macro. You can select a component in the left drop-down box. The selection can be restricted by entering the component number or by entering the starting number of the component name. If there are
different shapes, available for this component, you can select the desired shape in the second drop-down box. To insert a macro from the
macro database you can either use the macro drop-down list or the Macro-Wizard button (extreme right button). If you know the name of the macro, select the name in the drop-down list and insert it in the document. if not, click on the "Wizard" button to open a dialog, which displays the descriptions for the macros. This method of selection refers only to the (old) macros from the database. For inserting
new macros use the menu command "Insert" -> "Macro-Object".
The Component bar
The
Component bar helps you to insert components and other objects. The buttons with the yellow
component symbols stand for a group of components respectively, such as turbines or heat exchangers. When you click on a button, you see a menu with all the component types that belong to this group. You can select one component type from these. The button with the
coloured lines opens a menu, from which you can select a
pipeline to be inserted. The button with the
Value Cross switches directly to the
Insert Value-Cross mode You can connect a value field either with a pipeline or with a component. The button with the
graphics symbols (rectangle, circle, triangle) helps you to insert
passive graphics elements. The
Text-button is used to insert
text fields. The
Traffic Lights-button is used to insert
alert fields. The
Icon with the button and the arrow helps you to insert buttons (
command buttons).
The Profile bar
The
profile bar is useful if you have more than one profile for your document, e.g. a design case and several partial load cases. In the profile bar, there is a combo box that displays the active profile. There you can switch to another profile. The "P" button is used to create, manage, or delete profiles.
The Status bar
The status bar on the bottom of the EBSILONProfessional window displays short messages like hints for usage. If you leave the cursor on a button for a while, a yellow hint box appears and you get a message in the status bar telling you what you to do with that button.
The status bar also displays the name of a selected object and, if needed, also error messages.
When using a prepaid licence, the remaining usage time is displayed on the far right of the status bar.
The Object bar
The
object bar contains the name and the type of the objects present in the model. If you highlight an object in the model, then it also appears in the list and vice versa. This list can be sorted on name or on type or on selection status.
The Profile Options bar
The
profile options bar displays the valid settings for the active profile. The settings can also be modified here.
The Definition Evolution bar
With the help of the definition evolution bar it is possible to display the development of a variable definition (mass flow M, pressure P or enthalpy H). In this way, it is possible to determine the component that specifies a variable. For this purpose, one can either activate the definition evolution or the backtracing of a variable. If one selects a backtracing (M, P or H) the cursor changes its shape and one can then select a line. From there, one can "move" to the clomponent in the model where this quantity is defined. The display is done graphically by displaying the model in shades of gray, the lines are colored (red for pressure, yellow for mass flow and blue for enthalpy). This display is operated by the counter to the right of the selection box or the slider to the right of it. These controls can be used to navigate back and forth through the stages of development.
The Message Bar
The
message bar is used to display messages, e.g. about the performance of calculations.
The Reports Bar
The
reports bar is used for the configuration of reports that are part of the model.
The Ebskernel Output Bar
The
Ebskernel output bar is used to display the output of print commands from components 93 (Kernel Scripting). If there are several components Kernel Scripting in the model, there is one sheet for each component and an additional summary sheet which displays the output of all components together in chronological order.
The Selection Bar
The
selection bar allows to restrict the selection process to
- all objects (default),
- all components, no components or the components of a certain type,
- all pipes, no pipes or the pipes of a certain type,,
- passive graphical elements,
- value crosses,
- text fields,
- alarm fields,
- buttons.
- other objects
The settings in this bar are used when you select objects in the model by drawing a frame (either a rectangle or a polygon) around certain objects.
The Result bar
This toolbar provides an overview of test results where the corresponding deviation (RELDEV) is higher than the preset limit (the limit can be set in the Model Settings under Validation). If you set the limit to 0 you get a complete list of test results.
The Equation bar
This toolbar provides a list of equations where the raw data analysis produced a higher breach than the preset limit (the limit can be set in the Model Settings under Validation). The criteria applied is the "relative imprecision” i.e. the proportion of the confidence interval of the deviation to the absolute value of the deviation. If the confidence interval is greater than the deviation, the value 0 is still within the confidence interval. In this case the deviation isn’t considered to be too high because the probability of a breach is less than 95%. If you set the limit to 0 you get a complete list of equations. This also applies if no raw data analysis is performed and the equations are met anyway (in simulation and validation). In the equation bar,
the format of the output
can be configured. In particular, it is possible to specify the
number of the significant figures. This makes it easier to find differences as here you can confine yourself to the relevant figures. Moreover, the choice of the iteration steps to be analyzed has been expanded. A
new column “Solved value for Pivot“ has been added as well. It shows the value of the Pivot element after the solution of the equation systems.


